Some random thoughts about Cliven Bundy

I’m with Jon Stewart:  I just don’t get it.  Here is a man who doesn’t recognize the United States government, but runs around with an American flag.  He thinks slavery was a fine institution, much better I guess than getting welfare, but Mr. Bundy doesn’t seem to realize that by grazing his cattle for free, he has been getting welfare for years.  Talk about welfare cheats!

And ya gotta love all those national political figures now in retreat.  I guess they were initially moved by the pictures of all those armed men prepared to put the women up front so they would die first.  But then came the comments about “Negroes”.   Dana Milbank had a great list of retreaters and their comments in his recent Washington Post column. 

Nevada cattle rancher Cliven Bundy knows how to start a stampede.

After Bundy, who became a right-wing hero for his refusal to acknowledge the authority of the federal government, wondered aloud about whether “Negro” people were “better off as slaves,” conservative figures who had celebrated his cause rushed to distance themselves from him.

Sen. Rand Paul (R-Ky.), who had condemned the federal government’s attempt to enforce court orders against Bundy: “Offensive.”

Sen. Dean Heller (R-Nev.), who had declared Bundy’s followers “patriots”: “Appalling and racist.”

And Sean Hannity, who had led a Fox News campaign that made a hero of Bundy: “Beyond repugnant.”

But Bundy’s daughter is still defending him.  According to Mother Jones

Bundy defended his initial comments on Thursday saying, “If they think I’m racist, they’re totally wrong…Again, I’m wondering are they better off under the old system of slavery or are they better off under the welfare slavery that they’re under now. You know, I’m not saying one way or the other.” And on Friday morning, he told CNN that he didn’t see a problem with using terms like “Negro” or “boy” for black people. “If those people cannot take those kind of words and not be (offended), then Martin Luther King hasn’t got his job done yet,” he told anchor Chris Cuomo.

Meanwhile, Bundy’s daughter, Shiree Bundy Cox, is striking back at conservatives who have turned tail on Bundy, especially Hannity. In a Facebook post Thursday night, she accused Hannity of abandoning her father and pandering to ratings. Here’s a snippet:

I’m sure most of you have heard the news about my dad being called a racist. Wow! The media loves to take things out of context don’t they? First off I’d just like to say that my dad has never been the most eloquent speaking person. Like someone said, he’s a Moses who needs an Aaron to speak for him. This is true. Second, however, is that the media has turned this into a circus side show. It’s like their trying to throw us off the real subject. Why was this ever even brought up? What does this have to do with land rights issues? Sean Hannity was all for reporting the happenings at the Bundy Ranch until this popped up. I wonder if someone hoped it would be that way…By the way, I think Mr. Hannity is more worried about his ratings than he really is about what my dad said. If he supports a supposed racist, what will that do to his ratings? He’s already lost his #1 spot on Fox.

If Shiree wants to understand the connection between land rights, race and taxes, Dana Milbank can explain it to her.

In general terms, Bundy’s notion of state supremacy — “I don’t recognize the United States government as even existing” — is a variant of states’-rights claims that go back to the Civil War and were revived in the segregationists’ opposition to civil rights laws. Because the federal government has been the protector of minority rights, states’ rights have long been used to justify discrimination.

Specifically, the Southern Poverty Law Center, which tracks anti-government and hate groups, says that Bundy’s sentiments align closely with those of the “Posse Comitatus” movement, founded by William Potter Gale in the 1970s. That movement based its anti-tax position — and its belief in the primacy of county and state authority over the federal government — on a belief that the levers of national power were controlled by Jewish bankers. “Most of the ideas that bolster positions like Cliven’s that the federal government doesn’t exist come from Posse Comitatus ideology,” the SPLC’s Ryan Lenz argues. And that ideology is rooted in bigotry.

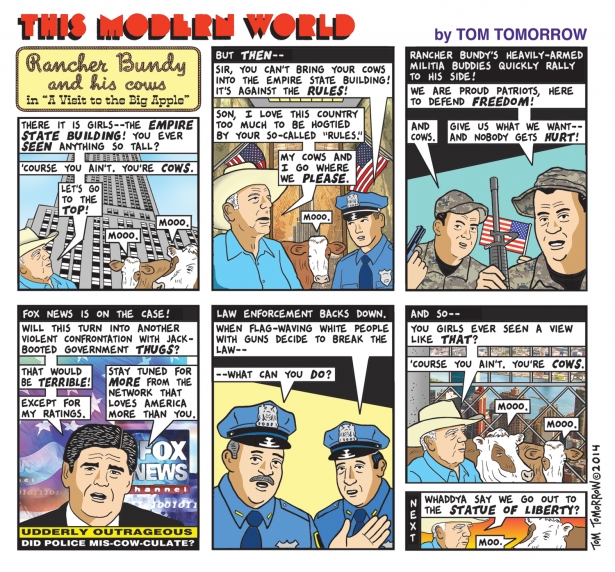
I’m not sure how this will get resolved without violence, but if no action is taken I’m afraid that the discussion will pivot again into a questioning President Obama’s “manhood” for not fighting.  This will really obscure the issues.  In the meanwhile, we have Tom Tomorrow.

TT and Bundy


Spending and the deficit

There is a lot of information floating around out there, but I just got these charts from my Congressman, Mike Capuano, and I wanted to share them.

The Bottom Line
The statistics and chart below will prove two points despite any rhetoric to the contrary:
  1. Federal spending is headed towards the lowest share of GDP in memory;
  2. The federal government is making great progress towards reducing our annual deficit.
A Note about Federal Spending
If you listen only to a few talking heads you might think that the federal government is engaged in a spending frenzy.  That is actually not the case.  In fact, our government is currently spending LESS than it did in 1974 on discretionary spending programs, the year that detailed economic records were first compiled.
We all know that a dollar doesn’t go as far as it once did – so measuring any spending over a 40 year period demands adjustment.  One way to do this is to look at government spending as a percentage of the Gross Domestic Product (GDP). The chart below with data from the Congressional Budget Office (CBO) illustrates that in 1974, federal government spending under the Nixon Administration equaled 9.3% of ALL spending in the country (the GDP).  Discretionary spending peaked in 1983 under the Reagan Administration at 10% of GDP.  The most recent figures show that federal spending last year under President Obama fell to just 7.2% of GDP and is estimated to decline even further over the next several years.
Historically, the lowest level of discretionary government spending in the last 40 years occurred in 1999 under the Clinton Administration, and it rose steadily from 6.1% to 7.7% during the George W. Bush Administration.
The point I am trying to make is that it is important to keep federal spending in perspective.  Your federal government today is spending a much smaller share than President Reagan ever did and more spending cuts are coming.  Many of us think it is long past time to face reality and truly consider the future of our country. Do we want good roads? Do we want good schools?  If the answer is yes, then it’s time to start paying for them.
At this point in our nation’s history, we should be investing again in our future. Our economy is improving and the federal budget has stabilized. The notion that federal spending is out of control just isn’t accurate. Take a look at the chart (or click here for a larger version) and table below, which illustrate my argument:
Discretionary Outlays Since 1974
as % of Gross Domestic Product (GDP)

FY

Defense

Nondefense

Total

Nixon 1974

5.4

3.9

9.3

Ford 1975

5.4

4.4

9.8

Ford 1976

5.0

4.8

9.8

Carter 1977

4.8

4.9

9.7

Carter 1978

4.6

5.0

9.6

Carter 1979

4.5

4.8

9.3

Carter 1980

4.8

5.1

9.9

Reagan 1981

5.0

4.8

9.8

Reagan 1982

5.6

4.2

9.8

Reagan 1983

5.9

4.1

10.0

Reagan 1984

5.8

3.8

9.6

Reagan 1985

5.9

3.8

9.7

Reagan 1986

6.0

3.6

9.7

Reagan 1987

5.9

3.4

9.3

Reagan 1988

5.6

3.4

9.0

Bush 1989

5.5

3.3

8.8

Bush 1990

5.1

3.4

8.5

Bush 1991

5.2

3.5

8.7

Bush 1992

4.7

3.6

8.3

Clinton 1993

4.3

3.6

7.9

Clinton 1994

3.9

3.6

7.5

Clinton 1995

3.6

3.6

7.2

Clinton 1996

3.3

3.3

6.7

Clinton 1997

3.2

3.2

6.4

Clinton 1998

3.0

3.1

6.2

Clinton 1999

2.9

3.1

6.0

Clinton 2000

2.9

3.1

6.1

GW Bush 2001

2.9

3.2

6.1

GW Bush 2002

3.2

3.5

6.7

GW Bush 2003

3.6

3.7

7.3

GW Bush 2004

3.8

3.6

7.4

GW Bush 2005

3.8

3.7

7.5

GW Bush 2006

3.8

3.6

7.4

GW Bush 2007

3.8

3.4

7.3

GW Bush 2008

4.2

3.5

7.7

Obama 2009

4.6

4.0

8.6

Obama 2010

4.7

4.5

9.1

Obama 2011

4.5

4.2

8.8

Obama 2012

4.2

3.8

8.0

Obama 2013

3.8

3.5

7.2

Obama 2014 EST

3.5

3.4

6.9

Obama 2015 EST

3.3

3.2

6.6

Obama 2016 EST

3.2

3.0

6.2

2017 EST

3.1

2.9

6.0

2018 EST

3.0

2.8

5.8

2019 EST

2.9

2.7

5.7

2020 EST

2.9

2.7

5.6

2021 EST

2.8

2.6

5.4

2022 EST

2.8

2.6

5.4

2023 EST

2.7

2.5

5.3

2024 EST

2.7

2.5

5.2

Sources: Cong Budget Office; Office of Management and Budget

The Federal Deficit
We have heard a lot of talk about the federal deficit. The chart belowshows the amount of the annual deficit, or in some cases, surplus,generated by the federal government.  There are many ways to interpret these statistics and I would like to offer a few comments.
You can see there have been only four years since 1974 wherea surplus was generated– the last three years under PresidentClinton and the first year under PresidentGW Bush.  One could argue that the 2001 surplus should be credited to Clinton policies – butI will leave that aside.  However, it is clear that the federal governmentstarted regenerating deficits under Bush policies – most notably his first tax cut in 2001 (before the 9/11 attack).  Certainly, the terrorist attacks on September 11th and the country’s decision to engage in Afghanistan impacted the economy. However,the federal government made a conscious decision to turn away from fiscal discipline BEFORE September 11th.
One can quickly notice the impact of the 2008 economic crisis and our reaction to it.  Regardless of how you might feel about the stimulus and the bailouts – at least it was clearwhat the short term effect would be on the federal deficit.  I happen to think BOTH those actions were necessary and appropriate to save our economy from an even worse fate. Certainly the bailout should have had more teeth. Remember though it was passed under the Bush Administration so those of us calling for more teeth were drowned out.The only choice we faced was action or inaction, and we chose action. I also believe that the stimulus should have been more targeted on creating jobs.  Unfortunately, Congress never has a choice between perfect options – it is always a choice between imperfect plans.  I understand thatmost people have formed pretty strongopinionsabout the actions that the government took and I will let history decide whether those actions were appropriate.
Since the economic crisis in 2008, the federal government has been making significant and steady progress towards reducing our annual deficit.  The average deficit over the 43 years covered by this table equals 3.1% of the GDP. This chart doesn’t show it, but by the end of the Obama Administration it will be below that historic average. Remember, absolute numbers like these only tell a portion of the story.
My final note on this is historic.  This chart shows the deficits and surpluses under 20 years of Democratic Presidents and 22 years of Republican Presidents … good times and bad … war and peace.  I think the most important measure is the change from one year to the next. Maybe we cannot achieve our goals in one year, but are we making progress?  Based on this chart you can calculate that under Democratic Presidents, the deficit was REDUCED by an average of $22.3 billion each year … under Republican Presidents that Deficit has been INCREASED by an average of $44.5 billion each year.  I’ll let you decide which course is the better one.

Revenues

Revenues Change %

Outlays

Outlays Change %

Total Deficit / Surplus

Change $

Nixon 1974

263.2

269.4

-6.1

Ford 1975

279.1

6%

332.3

23%

-53.2

-47.1

Ford 1976

298.1

7%

371.8

12%

-73.7

-20.5

Carter 1977

355.6

19%

409.2

10%

-53.7

20.1

Carter 1978

399.6

12%

458.7

12%

-59.2

-5.5

Carter 1979

463.3

16%

504.0

10%

-40.7

18.5

Carter 1980

517.1

12%

590.9

17%

-73.8

-33.1

Reagan 1981

599.3

16%

678.2

15%

-79.0

-5.1

Reagan 1982

617.8

3%

745.7

10%

-128.0

-49.0

Reagan 1983

600.6

-3%

808.4

8%

-207.8

-79.8

Reagan 1984

666.4

11%

851.8

5%

-185.4

22.4

Reagan 1985

734.0

10%

946.3

11%

-212.3

-26.9

Reagan 1986

769.2

5%

990.4

5%

-221.2

-8.9

Reagan 1987

854.3

11%

1,004.0

1%

-149.7

71.5

Reagan 1988

909.2

6%

1,064.4

6%

-155.2

-5.4

Bush 1989

991.1

9%

1,143.7

7%

-152.6

2.5

Bush 1990

1,032.0

4%

1,253.0

10%

-221.0

-68.4

Bush 1991

1,055.0

2%

1,324.2

6%

-269.2

-48.2

Bush 1992

1,091.2

3%

1,381.5

4%

-290.3

-21.1

Clinton 1993

1,154.3

6%

1,409.4

2%

-255.1

35.3

Clinton 1994

1,258.6

9%

1,461.8

4%

-203.2

51.9

Clinton 1995

1,351.8

7%

1,515.7

4%

-164.0

39.2

Clinton 1996

1,453.1

7%

1,560.5

3%

-107.4

56.5

Clinton 1997

1,579.2

9%

1,601.1

3%

-21.9

85.5

Clinton 1998

1,721.7

9%

1,652.5

3%

69.3

91.2

Clinton 1999

1,827.5

6%

1,701.8

3%

125.6

56.3

Clinton 2000

2,025.2

11%

1,789.0

5%

236.2

110.6

GW Bush 2001

1,991.1

-2%

1,862.8

4%

128.2

-108.0

GW Bush 2002

1,853.1

-7%

2,010.9

8%

-157.8

-286.0

GW Bush 2003

1,782.3

-4%

2,159.9

7%

-377.6

-219.8

GW Bush 2004

1,880.1

5%

2,292.8

6%

-412.7

-35.1

GW Bush 2005

2,153.6

15%

2,472.0

8%

-318.3

94.4

GW Bush 2006

2,406.9

12%

2,655.1

7%

-248.2

70.2

GW Bush 2007

2,568.0

7%

2,728.7

3%

-160.7

87.5

GW Bush 2008

2,524.0

-2%

2,982.5

9%

-458.6

-297.9

Obama 2009

2,105.0

-17%

3,517.7

18%

-1,412.7

-954.1

Obama 2010

2,162.7

3%

3,457.1

-2%

-1,294.4

118.3

Obama 2011

2,303.5

7%

3,603.1

4%

-1,299.6

-5.2

Obama 2012

2,450.2

6%

3,537.1

-2%

-1,087.0

212.6

Obama 2013

2,774.0

13%

3,454.3

-2%

-680.3

406.7

Obama 2014 EST

-514.0

166.3

Obama 2015 EST

-478.0

36.0

Obama 2016 EST

-539.0

-61.0


 My bottom line? Let’s spend some money and create some jobs.

Post is cut and pasted from an email update from Congressman Michael Capuano. 7th CD, Massachusetts.